Basics
It's no secret that we love a good chart! Charts provide an accessible snapshot of key data to help your Users get a sense of where things are and where they're headed. A charts Record Insight is the perfect way to encapsulate recent attendance totals
for Groups or recent Household giving. As with all things Record Insights, the sky's the limit, so get creative. And don't forget to show your work in the MP Community so we can oooh and awww (and maybe borrow some ideas).
- Charts are our jam! So we added these chart Record Insights so they can be your jam, too!
- Contacts Page: Contacts recent activity by month
- Households Page: Household recent activity by month
- Participants Page: Participant's recent activity by month
- Groups Page: Group's recent attendance totals
- Events Page: Event registration by registration date
- Donors Page: Donor's giving history
- Pledge Campaign Page: Pledget Campaign history
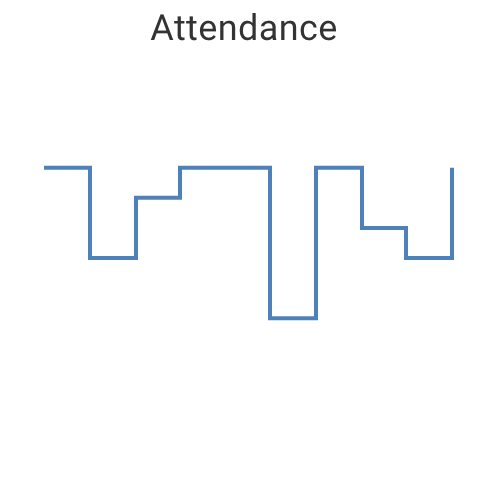
- The chart Record Insight is based on a subpage view, so think strategically about where the data you want in your view is and where you can build a view that puts the information into one row per data point. For example, for the Group Attendance Record
Insight above, the subpage view is on the Rooms & Groups tab of the Group record. Pro tip: Build your view before configuring your insight.
- Hovering over a section of the chart will display the data point.
- A note of caution: Record Insights should be just that—a quick insight to the record. Build charts Record Insights that will be useful for that page. And be aware that those charts will probably be different
than your view charts.
Configuration
 MinistryPlatform comes preloaded with a whole bunch of Record Insights. But if you want to add your own, you can do that if you have access to the System Setup section. Here's how ...
- Build your view on the desired tab of the page that will display the Record Insight. Your view must display the information to
be plotted in a single row. So the view for our sample Record Insight shows Group Attendance for the past six months of meetings, with one Event date per row.
- Some charts will need at least two columns, one for the X-axis (horizontal) and one for the Y-Axis (vertical).
- Some charts will only include the Y-Axis.
- System Setup > Insights
- Click the "+" to create a completely new Record Insight. Or find one you like and hit that copy button.
- Add/Edit the desired information
- View Order: The order this insight will appear in, from left to right.
- Active: Whether the insight will show up on the page. If it is no longer relevant, set this to No.
- Save
Chart Templates
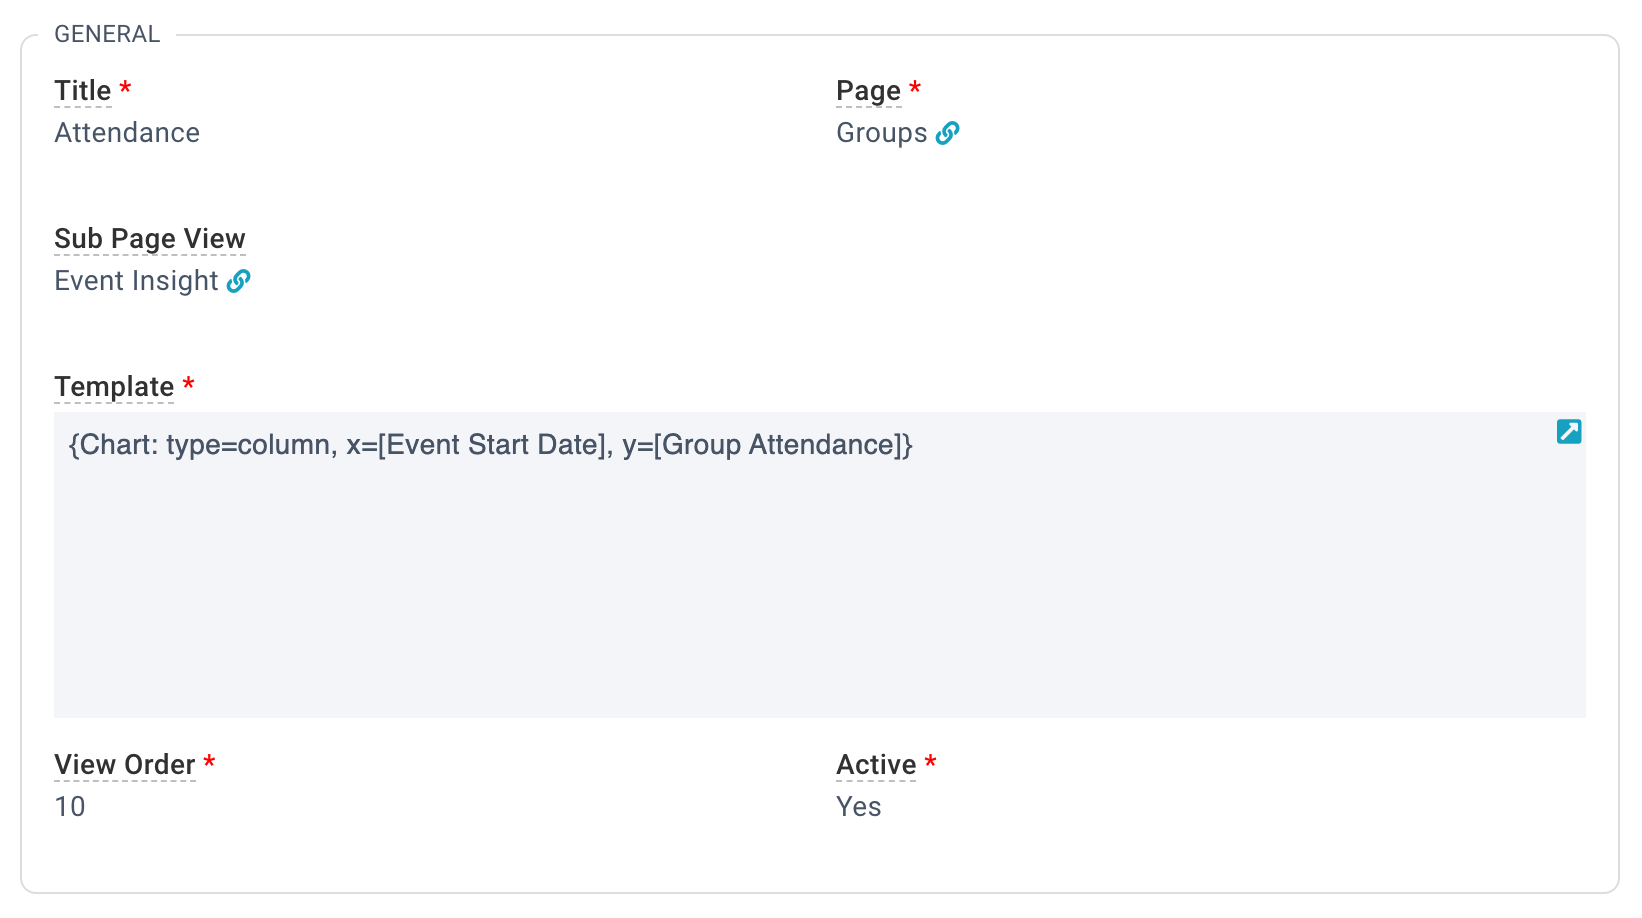
Copying the template below is a great way to go! But be sure to switch the Template field into source mode (by taping that "</>" button) before pasting.
{Chart: type=column, x=[Event Start Date], y=[Group Attendance]}Available Charts
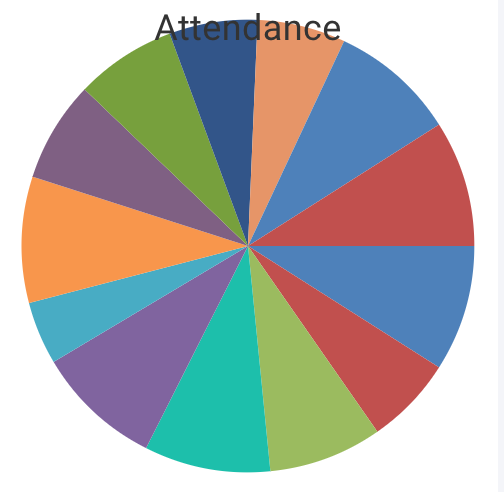
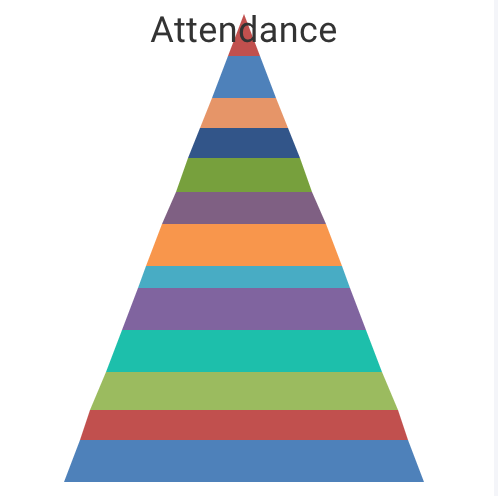
Options, options everywhere! Different data calls for different charts. But don't worry, we've got you covered with a whole menu of chart-type options.
Pick the chart type that works for you! And don't be afraid to try a new chart type; you can always change it back if it doesn't work out ;). Important: Chart names are case sensitive, so be sure to copy the chart names exactly.